Monitoring Automation Runs
Monitoring Automation Runs
The Automate Dashboard is where you monitor how your automations are performing: how many times they've run, how many succeeded or failed, how long they take, and the full request and response of every action.
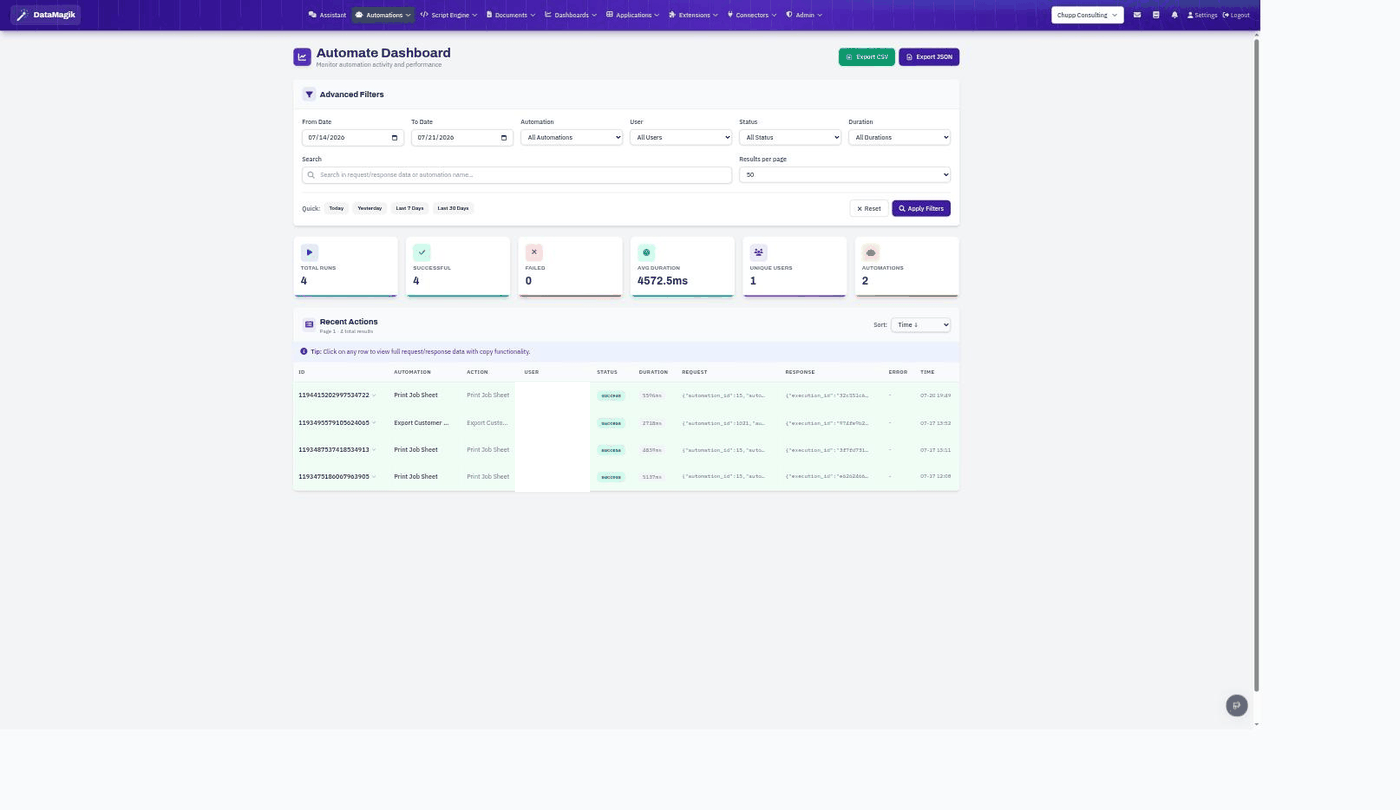
What it shows
The tiles summarize Total Runs, Successful, Failed, Avg Duration, Unique Users, and how many distinct Automations ran. Below them, the Recent Actions table lists each run with its automation, action, status, duration, and time. Click any row to see the full request and response data, with a copy button — handy for debugging what an action actually sent and received.
Filtering & export
Use the Advanced Filters to narrow by date range, automation, user, status, or duration, or search within the request/response data. Quick buttons jump to Today, Yesterday, Last 7 Days, or Last 30 Days. Export the filtered results with Export CSV or Export JSON.