Testing Workflows
Testing workflows
Test a workflow in the editor as you build it. A test run runs the canvas as it is now, saved or not, and shows what every step did. Test runs go through the Script Engine like any other run, so each one is also recorded in Executions.
Why test runs are safe
On a test run, steps that would change things outside DataMagik hold back unless you say otherwise:
| Step | On a test run | To do it for real |
|---|---|---|
| Plex Data Source (a writing data source), Plex API (anything but a read) | Shown, not sent to production Plex | Tick Use Plex test to send it to your Plex test environment, or tick Really write to production Plex on test runs |
| Send Email | Captured, not sent | Tick Really send emails (otherwise they are captured) in the Test run panel |
| Print Label | Rendered and shown, not printed; no real serials used | Really print on test runs |
| Serial Numbers | The next number is previewed, not taken | Use up real numbers on test runs |
| Teams / Slack Message | The card is shown, not posted | Really send on test runs |
| Send EDI | Built, validated and logged, not delivered | Really send on test runs |
| Database (statements that change data) | Shown, not run. Reads always run. | Really write on test runs |
| PLC / Shop Floor (writes) | Shown, not sent | Really write on test runs |
| Request Approval | Pretends it was approved (or rejected) | On test runs: Create a real approval task |
| Only New Items | Shows what would be new without changing what scheduled runs remember | Remember on test runs too |
| Wait | Waits | Tick Don't wait on test runs to skip the pause |
| Run Script / Workflow | A child workflow runs as a test too, with the same holds |
These steps do act on test runs: HTTP Request, Write File, File Action, and Lookup Table saves and deletes. Point them at a sandbox or a test folder while you build.
Running a test
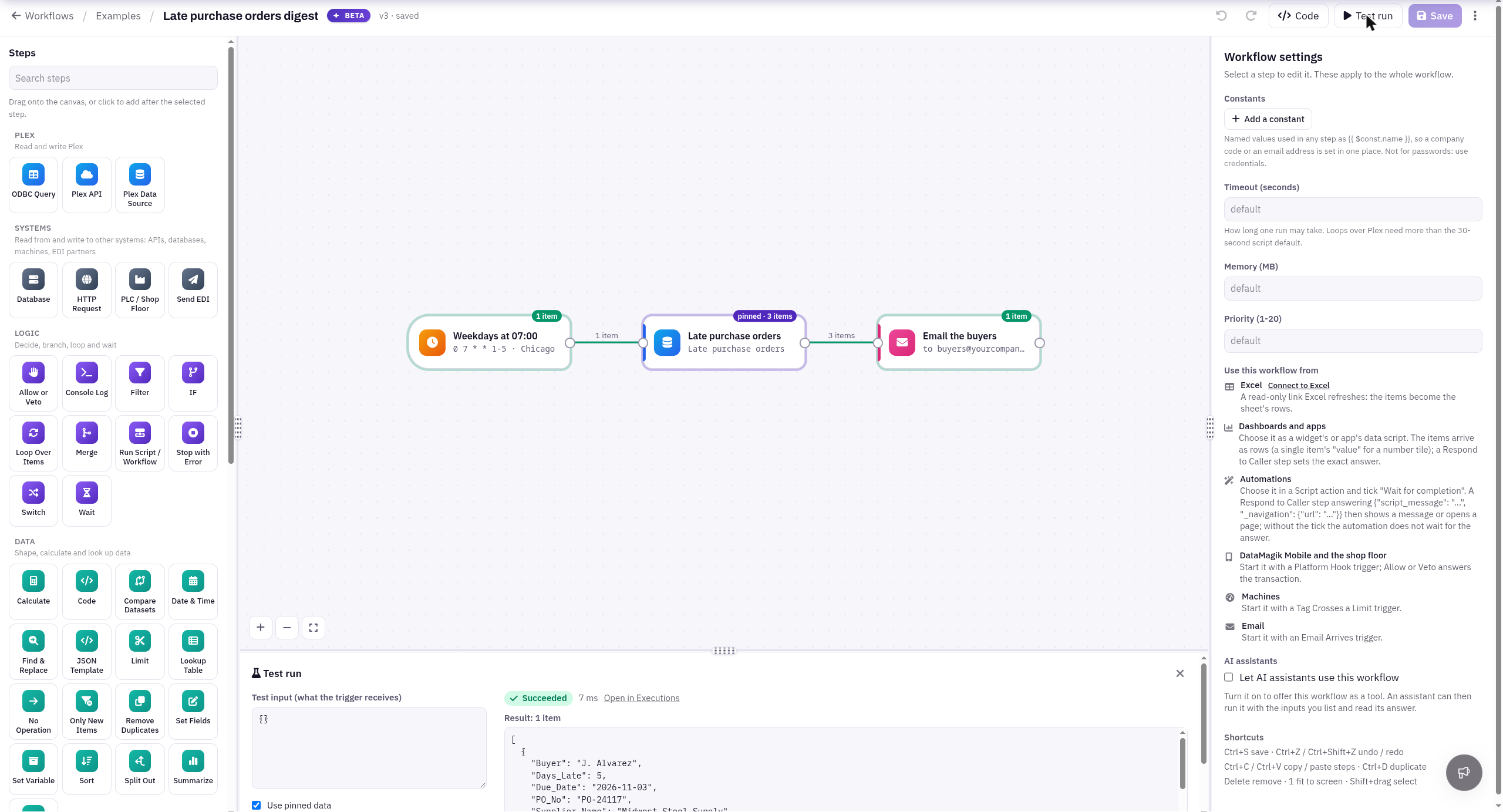
- Click Test run in the toolbar. The Test run panel opens at the bottom and the run starts.
- Test input (what the trigger receives) starts as the trigger's sample. Change it to try other cases, then click Run workflow.
- While the run goes, the Live console shows each step as it starts and finishes, and the canvas lights up each step.
- When it ends, the panel shows Succeeded or Failed, how long it took, the result items, and Open in Executions.
Options in the panel: Use pinned data, Really send emails (otherwise they are captured), and Stop at breakpoints.
Reading the results on the canvas
- Each step shows a badge: how many items it put out, or skipped, failed, pinned, or paused here.
- Connections that carried items show the count. Connections that carried nothing are dimmed, so you can see which branch the data took.
- Select a step and open its Output tab to see the items it put out, with a count per output and any log lines it wrote. Or double-click it for the wide view, with Input and Output side by side as a table, JSON or schema.
When a step fails
When a test run fails, the editor brings the failed step into view: it is selected, centred on the canvas, and its Output tab is open. You see:
- This step failed, with the error message.
- Log from this step, if it wrote any lines.
- Whole run log, for errors raised outside any one step.
The run's error starts with the name of the step that failed, so the same message in Executions or a failure alert tells you where to look.
Run up to here
To test part of a workflow, select a step and choose Run up to "step name" from the ⋮ menu. Only that step and the steps leading to it run, so later steps (an email, a Plex write) do not. An HTTP Request step also has Send a test request, which runs up to that step.
Running up to a step is also the quickest way to get data for the live preview of the next step's fields.
Pinned data
Pin a step's output to stop calling Plex (or any slow system) every time you test the steps after it.
- Run the workflow, or run up to the step.
- Open the step's Settings tab and click Pin last output. You can also type or paste JSON into Pinned data.
Test runs then use those items instead of running the step, and the step's badge says pinned. Click Unpin to run it for real again, or untick Use pinned data in the Test run panel for one run. Scheduled and API runs ignore pinned data.
Breakpoints and stepping through
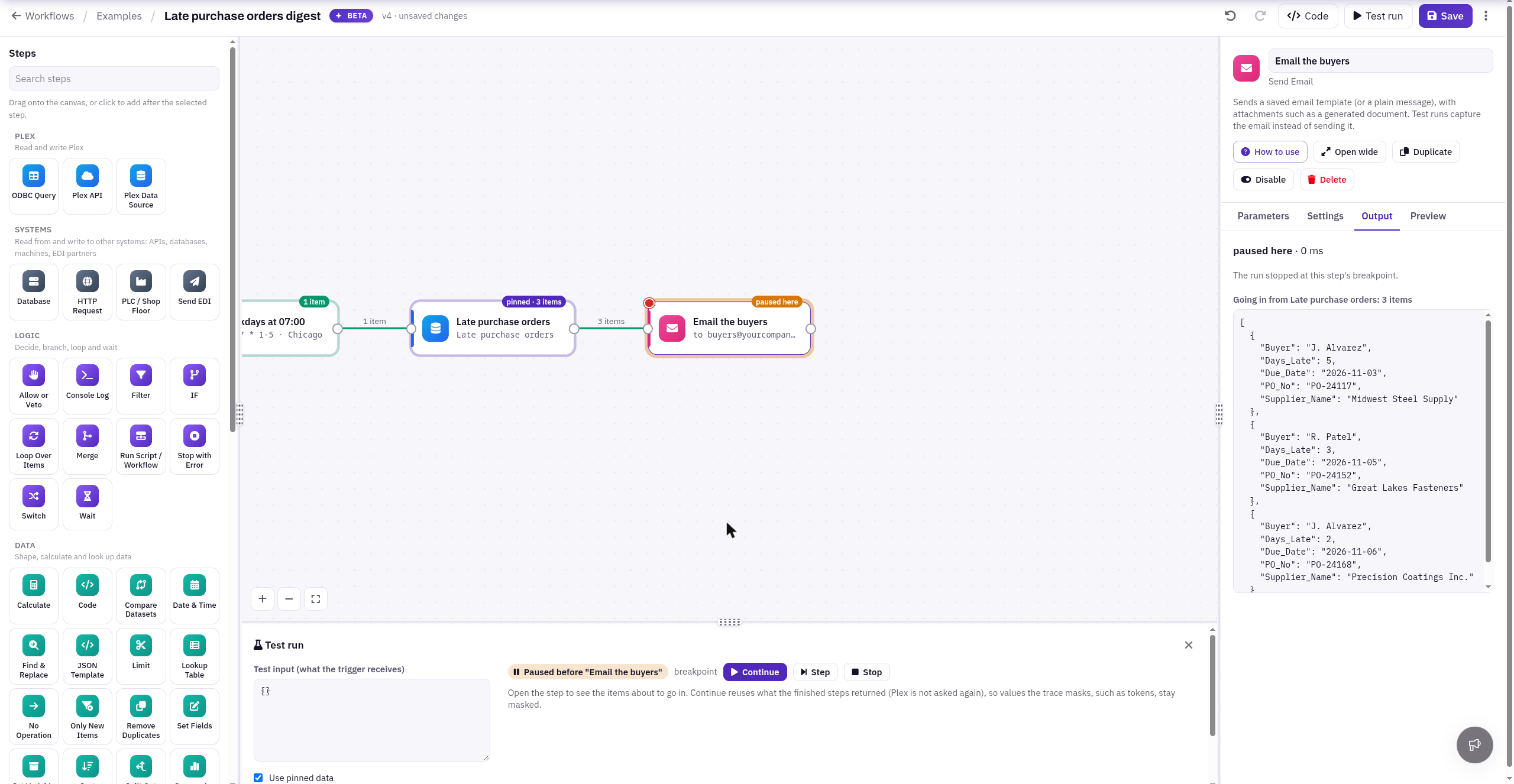
A breakpoint pauses a test run just before a step, so you can look at the items about to go in.
- Select a step and press F9, tick Breakpoint: pause test runs before this step (F9) on its Settings tab, or use Add breakpoint (F9) in the ⋮ menu. The step shows a red dot.
- Fill in Only when to pause only when a condition holds for one of the items going in, such as
{{ $json.qty > 100 }}. - Click Step through in the Test run panel to pause before every step, one at a time.
When the run pauses, the panel shows Paused before "step name" and the step's Output tab lists what is about to go in. Then:
- Continue (F8) runs on to the next breakpoint.
- Step (F10) runs this step and pauses before the next one.
- Stop ends the debugging session.
Continue reuses what the finished steps already returned, so Plex is not asked again. If you change the workflow while it is paused, it runs again from the start. Breakpoints only affect test runs; scheduled and API runs ignore them. A run cannot pause before its trigger.
The live console and the Console Log step
The Test run panel streams the run's console while it runs. Lines a step writes are also kept with that step and shown on its Output tab after the run.
To write your own line, add a Console Log step. It writes a line, such as {{ $json }} or a count, and passes the items on unchanged.
- Label goes in front of each line so it is easy to find.
- Level: Info, Warning or Error.
- Only on test runs keeps scheduled and API runs quiet.
- Set Run to Once with all items and log
{{ $items.length }}for a single count instead of one line per item.
Fields that look like secrets, such as passwords and tokens, are masked when a whole item is logged.
The Code view
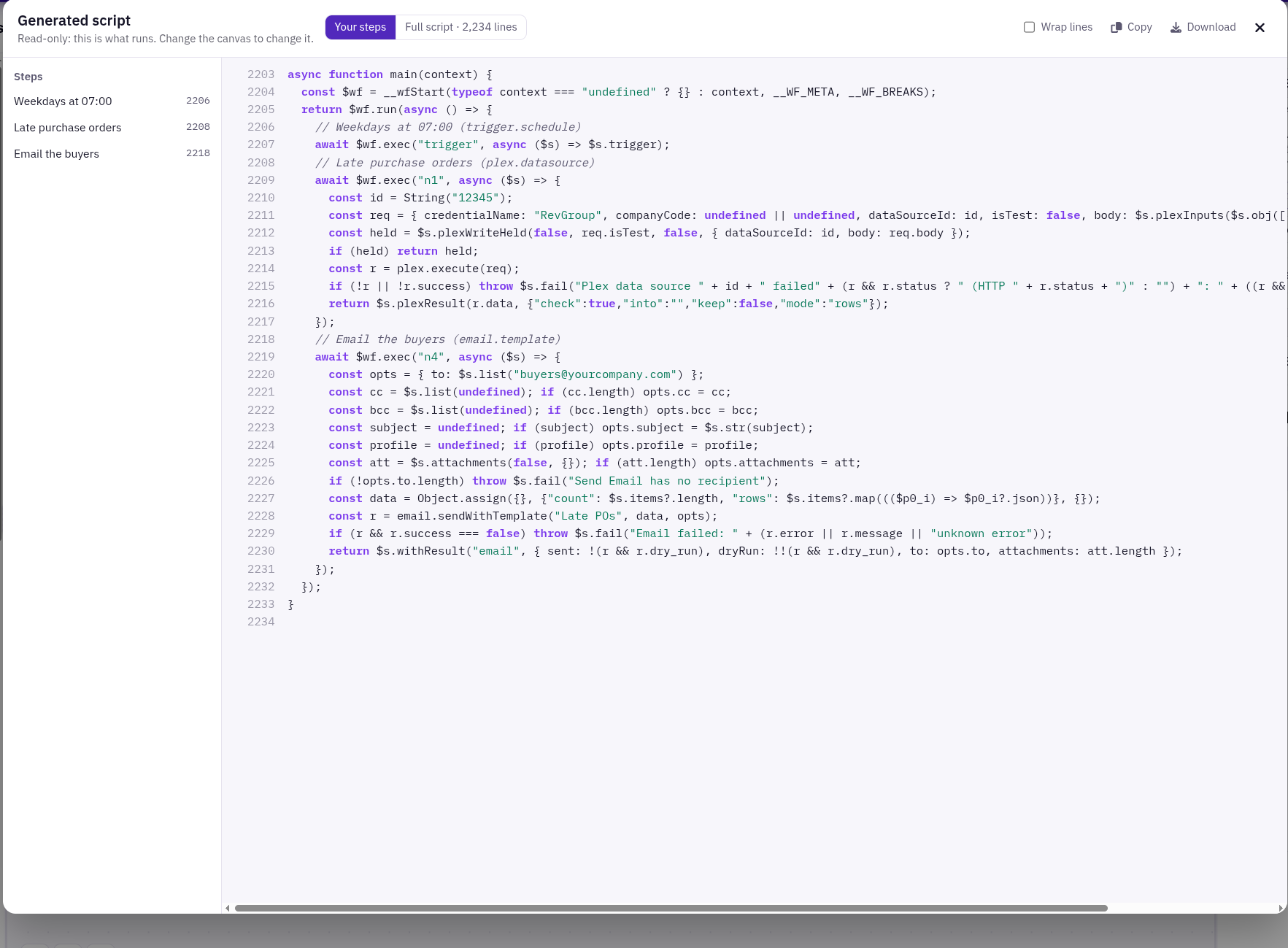
Click Code in the toolbar to see the Generated script: the JavaScript your workflow compiles to. It is read-only. To change it, change the canvas.
- Your steps shows your workflow's own code, with a list of steps on the left to jump to.
- Full script also shows the shared workflow runtime that every workflow carries.
- Line numbers are always the full script's, so they match the line numbers in a run's error messages.
- Wrap lines, Copy and Download are at the top.
If the workflow has problems that stop it compiling, the Code view lists them by step instead.